Hi, this is Sandra Henry-Stocker, author of the “Unix as a Second Language” blog on NetworkWorld.
In this Linux tip, we’re going to look at bmon. It’s a graphical tool for looking at network bandwidth. Once installed, bmon can be started simply by typing “bmon”. How much data it then provides depends on the size of your terminal window.
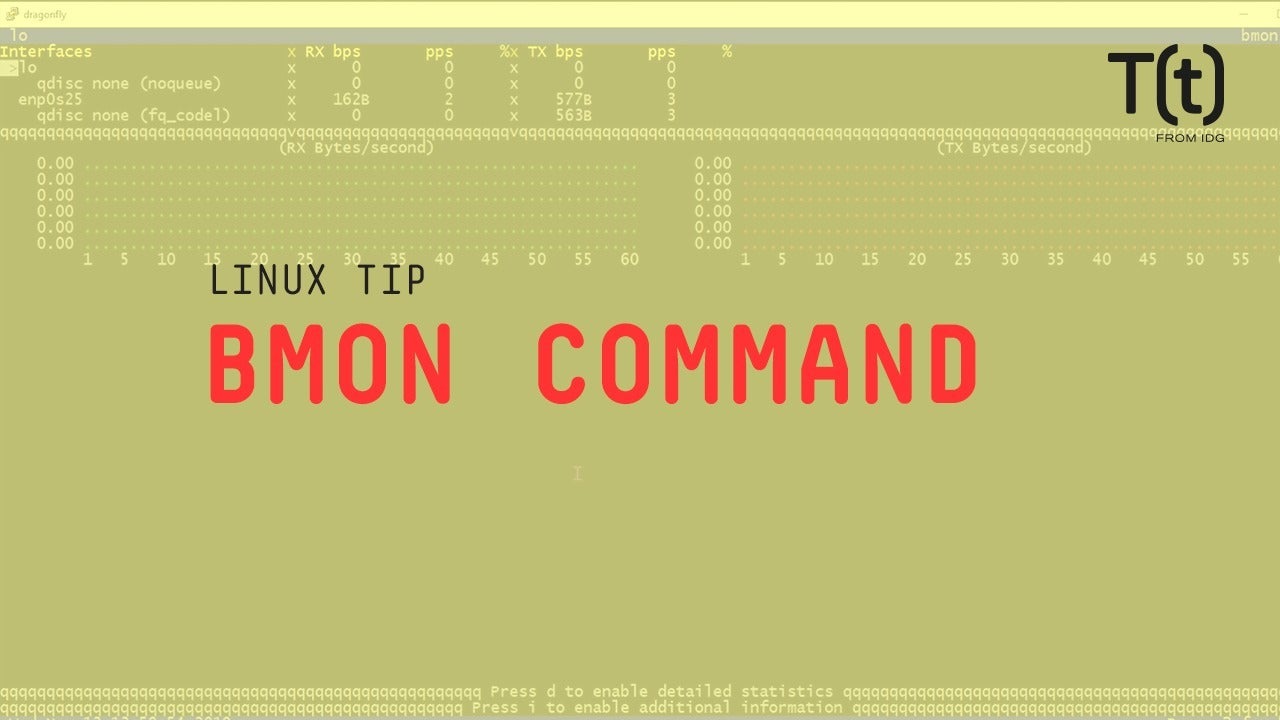
As you can see, we get a lot of data displayed right away. The section down here where the graph is displayed doesn’t look like much, but the setting near the upper left corner shows that we’re currently looking at the loopback interface. Use your down arrow key and go down to the normal network interface and the graph will show a lot of activity. RX and TX display received and transmitted packets. Notice the units adjust to the stats – bytes and kilobytes. We also seem some measurements in the top area that by default are updated every second.
RX bps – received bits per second
TX bps – transmitted bits per second
pps – packets per second
As you can see, this system is sending out a lot more packets than it’s receiving. The fact that I’m running this tool remotely is certainly contributing to that.
With a large enough screen, you can also bring up additional and very detailed statistics. As the hints on the screen suggest, type d to get detailed stats and i for additional information. The screen I’m using now has 143 columns and 44 rows.
If you want a little help, you can bring up a quick reference by pressing ?. You can press q to go back to the normal display. If you press q again, bmon will ask to confirm you request to quit. Press y and you’ll be back on the command line.
That’s your Linux tip for bmon. If you have questions or would like to suggest a topic, please add a comment below. And don’t forget to subscribe to the IDG Tech(talk) channel on YouTube.
If you liked this video, please hit the like and share buttons. For more Linux tips, be sure to follow us on Facebook, YouTube and NetworkWorld.com.